

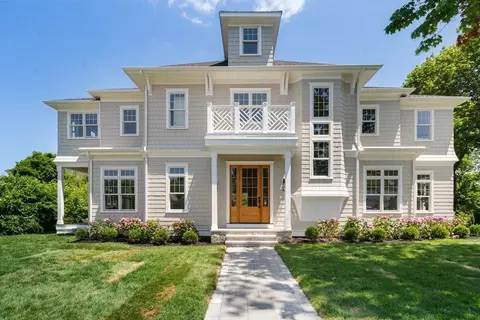
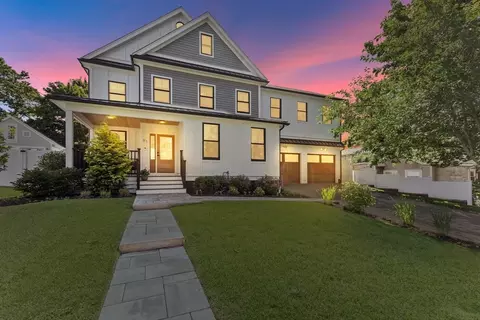
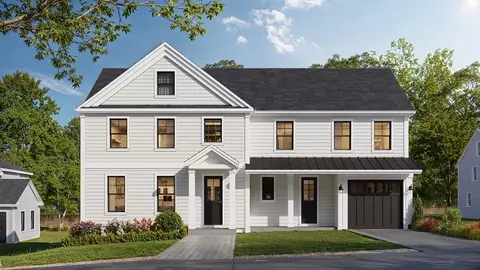
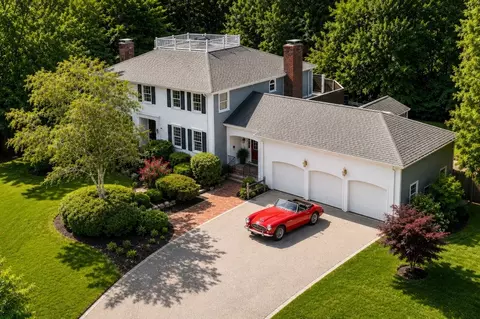
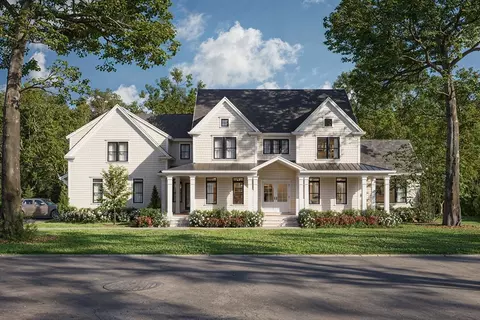
- $2,300,000
- 5Bd
- 5Ba
- 4,085 Sq Ft
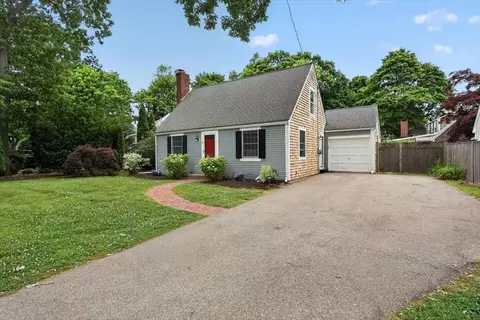
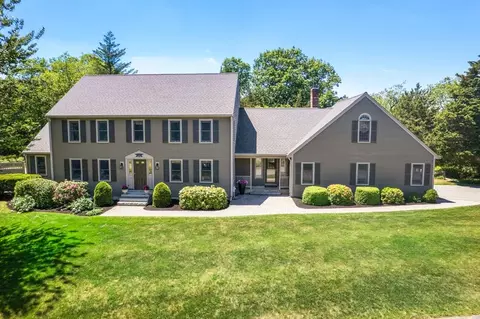
SOLD


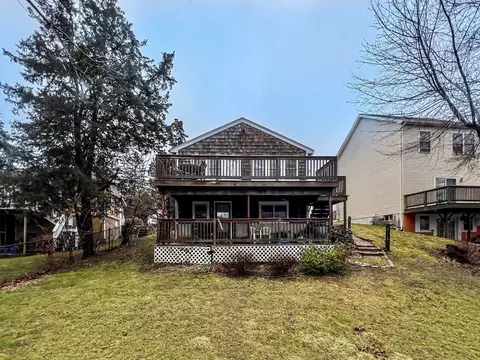
Last sold 05/25/2014 for $440K
bed
bath
Sqft ($132/Sqft)
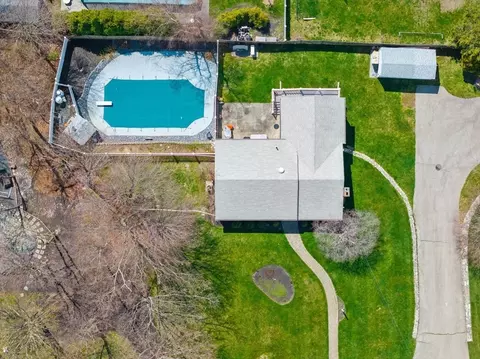
| Property type House | Year built 2019 | HOA fee $0/month | Lot size 6,346 Sqft | Movoto estimate |
| Est. value | Bed/bath | Sqft | mi | |
|---|---|---|---|---|
| 33 Foley Beach Rd, Hingham, MA 02043 | $1,553,000 | 4/3 | 2,322 | 0.01 |
| 37 Foley Beach Rd, Hingham, MA 02043 | $764,000 | 2/1 | 728 | 0.01 |
| 31 Foley Beach Rd, Hingham, MA 02043 | $741,000 | 2/1 | 1,092 | 0.02 |
| 39 Foley Beach Rd, Hingham, MA 02043 | $744,000 | 3/2 | 1,064 | 0.02 |
| 34 Foley Beach Rd, Hingham, MA 02043 | $1,784,000 | 4/3 | 2,211 | 0.03 |
| 36 Foley Beach Rd, Hingham, MA 02043 | $1,510,000 | 4/2 | 2,370 | 0.03 |
| 33 Kimball Beach Rd, Hingham, MA 02043 | $1,750,000 | 4/2 | 3,025 | 0.03 |
| 31 Kimball Beach Rd, Hingham, MA 02043 | $1,028,000 | 2/1 | 976 | 0.03 |
Estimated values are based on public record data and automated valuation models. Values are not guaranteed and may not reflect current market conditions.
$594,000
$1,395,000
$490,000
$738,500
$499,000
$789,000
$549,990
$999,999
$739,000
$595,000
$774,900
$575,000
$2,395,000
$749,900
$599,900
$549,900
$1,137,500
$739,000
$729,000
$789,000
$879,000
$597,000
$2,787,000
$739,900
$1,199,998
$679,900
$1,995,000
$2,125,000
$1,550,000
$826,350