
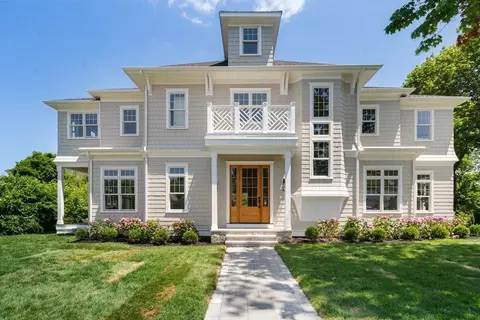
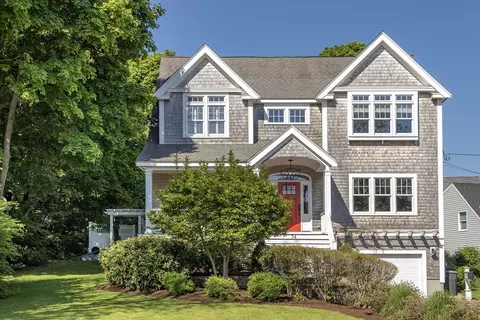
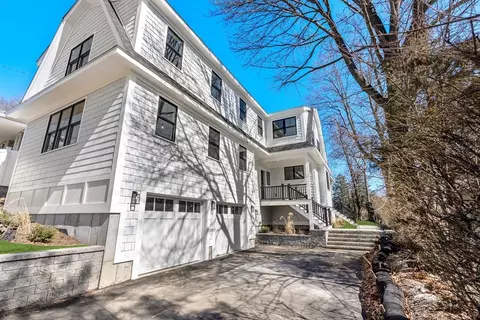
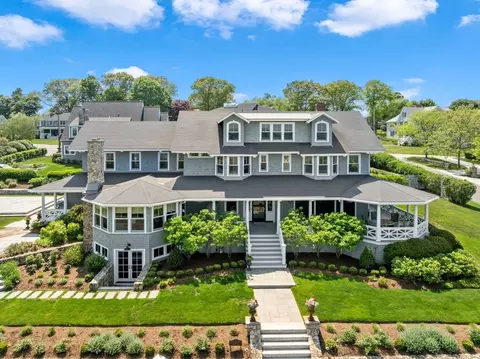
- $3,550,000
- 5Bd
- 6Ba
- 5,529 Sq Ft
SOLD 03/08/26


Last sold date unavailable
bed
bath
Sqft ($697/Sqft)
| Property type House | Year built 1950 | HOA fee $0/month | Lot size 0.29 Acre | Movoto estimate |
| Est. value | Bed/bath | Sqft | mi | |
|---|---|---|---|---|
| 19 Foley Beach Rd, Hingham, MA 02043 | $1,033,000 | 3/1 | 1,169 | 0.02 |
| 27 Foley Beach Rd, Hingham, MA 02043 | $2,917,000 | 4/3 | 4,612 | 0.03 |
| 49 Kimball Beach Rd, Hingham, MA 02043 | $1,181,000 | 2/1 | 2,211 | 0.03 |
| 45 Kimball Beach Rd, Hingham, MA 02043 | $1,739,000 | 4/2 | 2,631 | 0.03 |
| 24 Foley Beach Rd, Hingham, MA 02043 | $1,718,000 | 5/3 | 3,602 | 0.03 |
| 51 Kimball Beach Rd, Hingham, MA 02043 | $962,000 | 2/1 | 1,153 | 0.03 |
| 20 Foley Beach Rd, Hingham, MA 02043 | $1,168,000 | 3/1 | 1,276 | 0.03 |
| 47 Kimball Beach Rd, Hingham, MA 02043 | $1,059,000 | 3/1 | 1,264 | 0.03 |
Estimated values are based on public record data and automated valuation models. Values are not guaranteed and may not reflect current market conditions.


$594,000
$1,395,000
$490,000
$738,500
$499,000
$789,000
$549,990
$999,999
$739,000
$595,000
$774,900
$575,000
$2,395,000
$749,900
$599,900
$549,900
$1,137,500
$739,000
$729,000
$789,000
$879,000
$597,000
$2,787,000
$739,900
$1,199,998
$679,900
$1,995,000
$2,125,000
$1,550,000
$826,350