
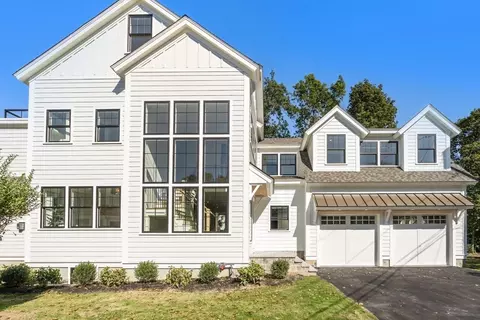
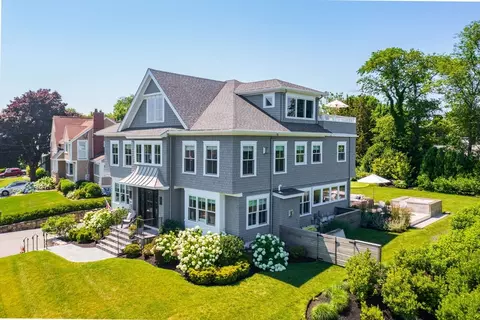
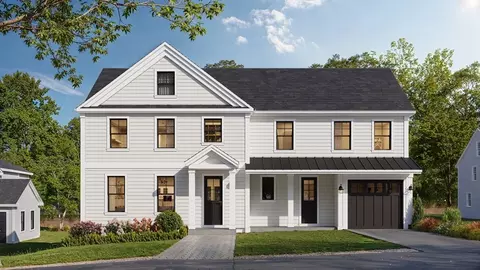
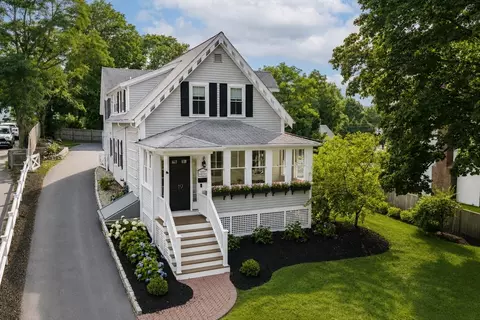
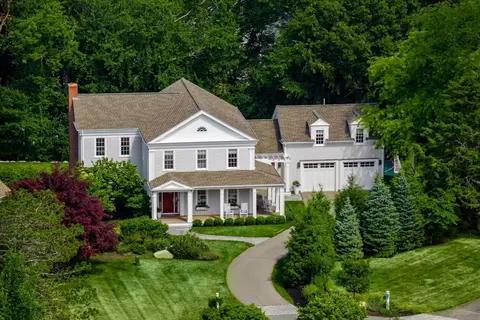
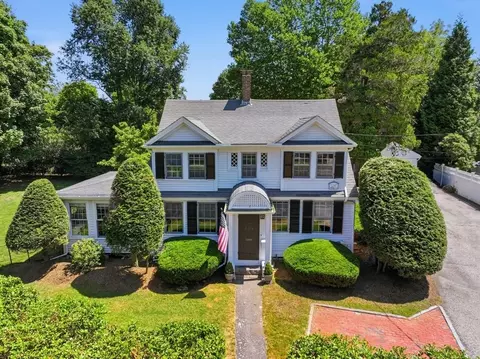
- $3,250,000
- 5Bd
- 5Ba
- 5,071 Sq Ft
SOLD


Last sold date unavailable
bed
bath
Sqft ($768/Sqft)
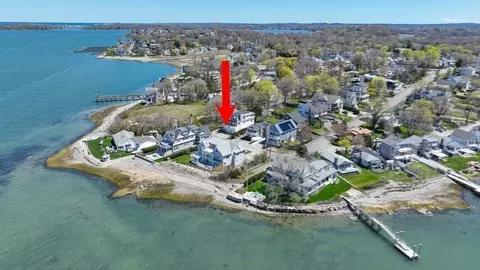
| Property type House | Year built 1930 | HOA fee $0/month | Lot size 8,880 Sqft | Movoto estimate | Rental estimate |
| Est. value | Bed/bath | Sqft | mi | |
|---|---|---|---|---|
| 3 Foley Beach Rd, Hingham, MA 02043 | $2,034,000 | 3/2 | 2,782 | 0.01 |
| 91 Kimball Beach Rd, Hingham, MA 02043 | $1,409,000 | 3/2 | 1,657 | 0.01 |
| 81 Kimball Beach Rd, Hingham, MA 02043 | — | 4/4 | 3,717 | 0.02 |
| 93 Kimball Beach Rd, Hingham, MA 02043 | — | 4/4 | 3,274 | 0.02 |
| 83 Kimball Beach Rd, Hingham, MA 02043 | $2,056,000 | 3/3 | 2,521 | 0.03 |
| 87 Kimball Beach Rd, Hingham, MA 02043 | $1,633,000 | 3/2 | 2,123 | 0.03 |
| 5 Foley Beach Rd, Hingham, MA 02043 | $1,568,000 | 5/3 | 2,152 | 0.03 |
| 95 Kimball Beach Rd, Hingham, MA 02043 | $2,103,000 | 3/2 | 1,915 | 0.03 |
Estimated values are based on public record data and automated valuation models. Values are not guaranteed and may not reflect current market conditions.

$594,000
$1,395,000
$490,000
$738,500
$499,000
$789,000
$549,990
$999,999
$739,000
$595,000
$774,900
$575,000
$2,395,000
$749,900
$599,900
$549,900
$1,137,500
$739,000
$729,000
$789,000
$879,000
$597,000
$2,787,000
$739,900
$1,199,998
$679,900
$1,995,000
$2,125,000
$1,550,000
$826,350