

- $145,000
- 3Bd
- 3Ba
- 1,524 Sq Ft
SOLD


Last sold 11/05/2016 after 94 Days
bed
bath
Sqft ($82/Sqft)
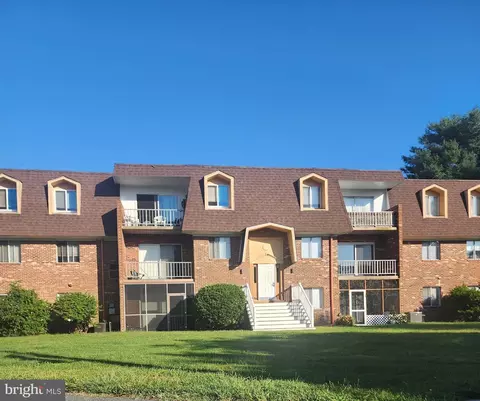
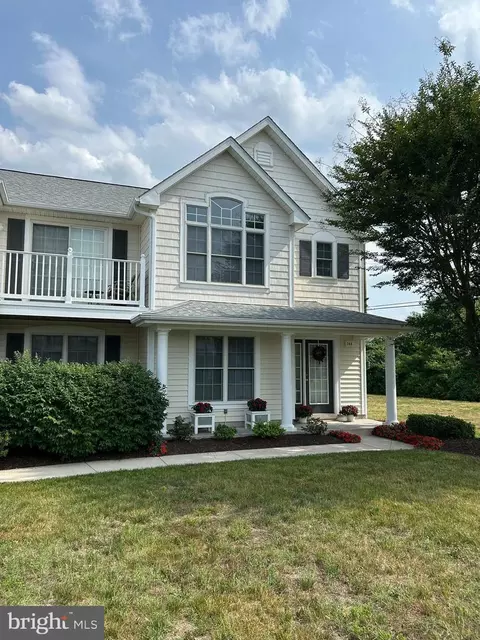
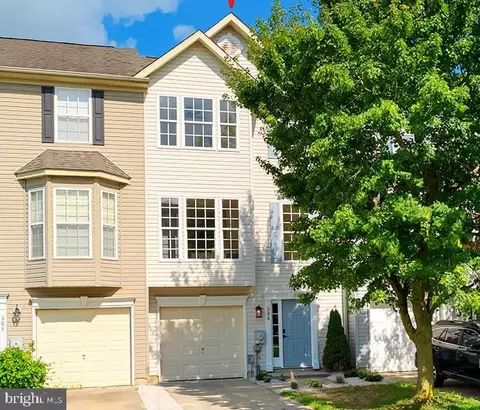
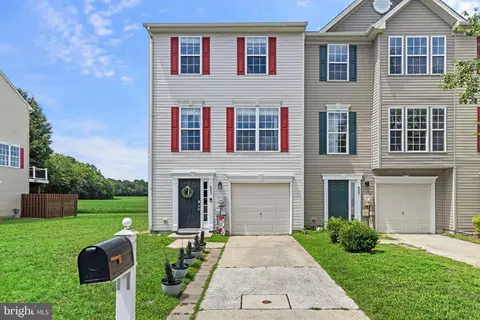
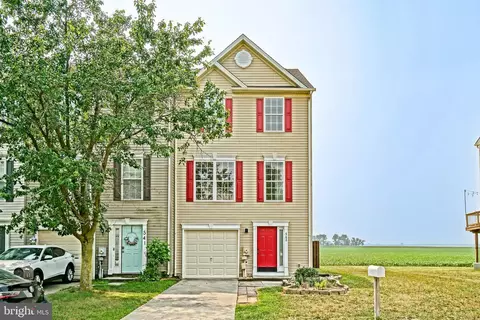
| Property type Townhouse | Neighborhood | Year built 2001 | HOA fee $1,500/month | Lot size 0.63 Acre |

| Overview | |
| Cooling/AC | Central A/C, Heat Pump(s) |
| Levels/Style | 3, Other |
| Type | Residential |
| Status | Closed |
| SqFt | 1426 |
| Lot Size (SqFt) | 27398 |
| Lot Size (Acres) | 0.63 |
| County Tax | 450, Annually |
| City/ Town Tax | 758 |
| Annual Property Tax | 1208 |
| Year Built | 2001 |
| HOA Fee | 0, Annually |
| New Construction (Y/N) | N |
| Condo/ Co-Op Fee | 1500 |
| Foreclosure (Y/N) | N |
| Interior | |
| Total # of Bathrooms | 3 |
| # Full Baths | 2 |
| # Half Baths | 1 |
| Total # of Bedrooms | 4 |
| Basement | Full, Walkout Level |
| Appliances | Dishwasher, Oven/Range - Electric, Refrigerator |
| Interior Features | Attic |
| Exterior | |
| Roof | Architectural Shingle |
| Foundation | Block |
| Parking Desc | None |
| Existing Structures | Above Grade |
| Amenities / Utilities | |
| Sewer/ Septic | Public Sewer |
| Pool | No Pool |
| Location | |
| Subdivision | CHARLES COURT |
| Water Source | Public |
| School District | CAPE HENLOPEN |
| Location | Corner Lot/Unit |
| Directions | From Route One, Go West On 16, Turn Left On Mulbury Street, Turn Left On Tobin, 111 Tobin Is At The Very End On The Left. |
| Zoning | TOWN CODES |
MLS # 1001020312 MLS # 6839872
MLS # 1000198118
| Est. value | Bed/bath | Sqft | mi | |
|---|---|---|---|---|
| 110 Tobin Dr, Milton, DE 19968 | $288,000 | 3/— | 1,248 | 0.02 |
| 112 Tobin Dr, Milton, DE 19968 | $268,000 | 2/— | 1,074 | 0.02 |
| 113 Tobin Dr, Milton, DE 19968 | $267,000 | 3/— | 1,140 | 0.02 |
| 115 Tobin Dr, Milton, DE 19968 | $246,000 | 3/— | 1,140 | 0.02 |
| 114 Tobin Dr, Milton, DE 19968 | $269,000 | 2/— | 1,074 | 0.02 |
| 116 Tobin Dr, Milton, DE 19968 | $284,000 | 2/2 | 1,248 | 0.02 |
| 117 Tobin Dr, Milton, DE 19968 | $275,000 | 3/— | 1,140 | 0.02 |
| 120 Tobin Dr, Milton, DE 19968 | $289,000 | 3/— | 1,248 | 0.04 |
Estimated values are based on public record data and automated valuation models. Values are not guaranteed and may not reflect current market conditions.
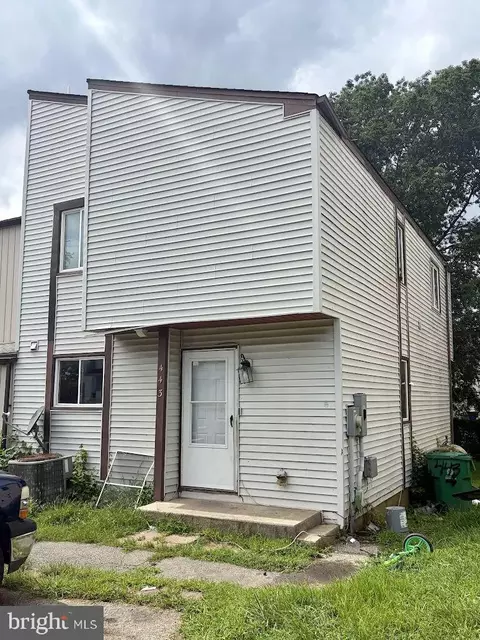

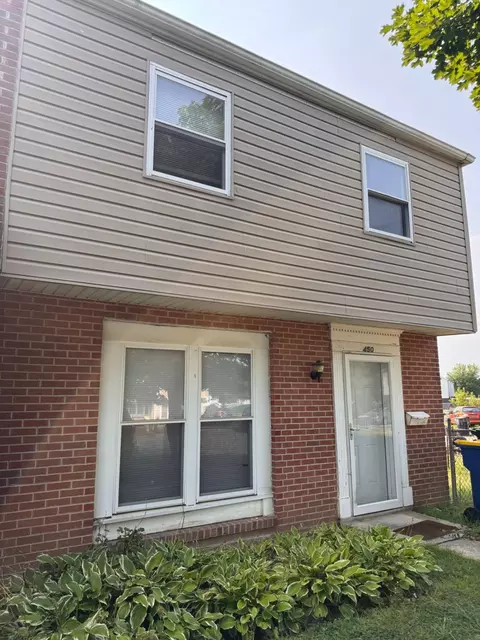


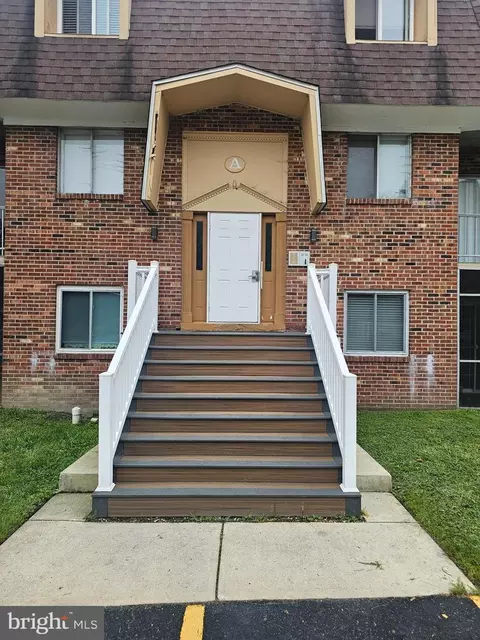
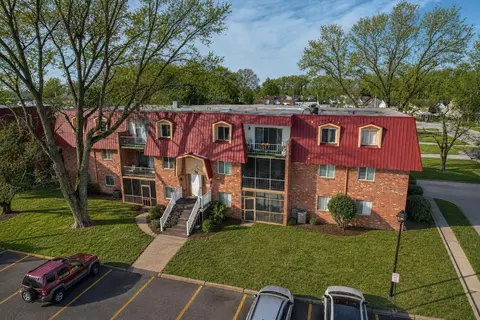

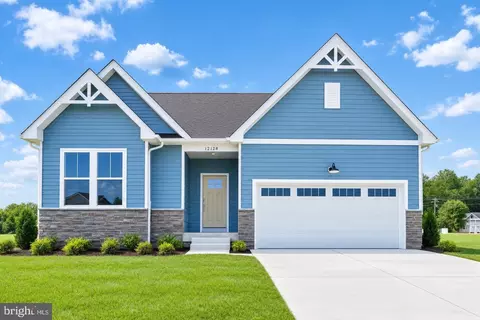
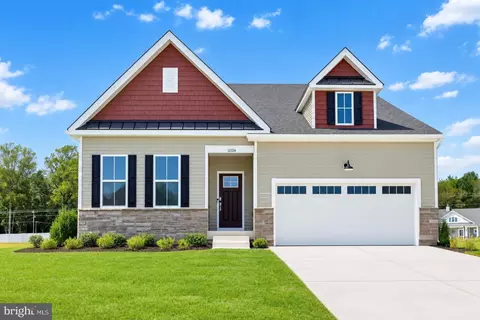
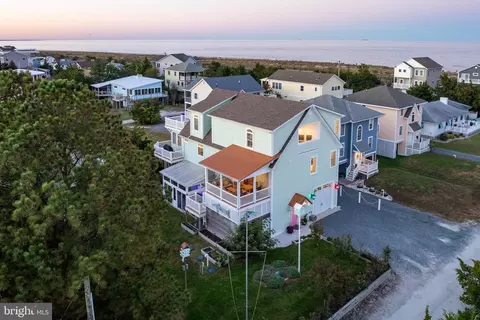
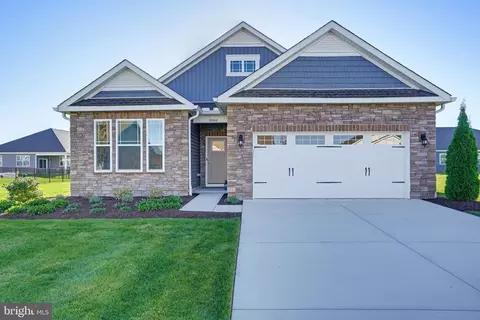
$519,990
$750,000
$1,610,000
$377,950
$280,490
$245,000
$359,990
$350,000
$460,000
$2,195,000
$734,624
$609,945
$444,490
$279,500
$375,287
$450,000
$531,589
$312,450
$300,625
$367,500
$145,000
$245,500
$387,500
$310,000
$502,500
$160,000
$390,000
$204,950
$235,000
$273,500