

- $285,000
- 3Bd
- 2Ba
- 1,572 Sq Ft
SOLD 06/22/26

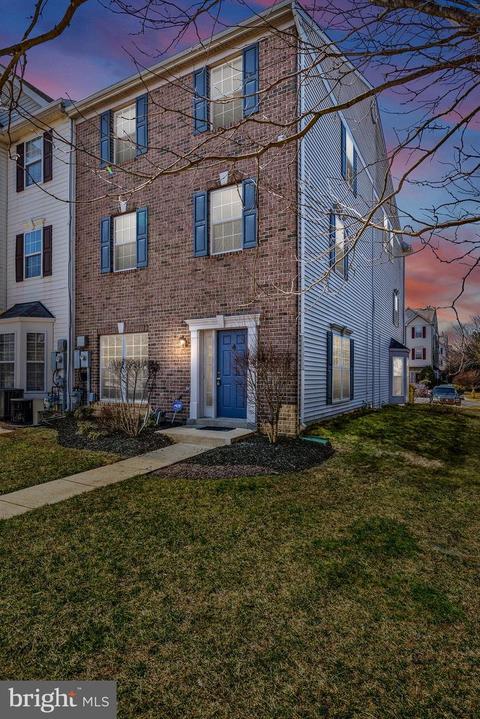
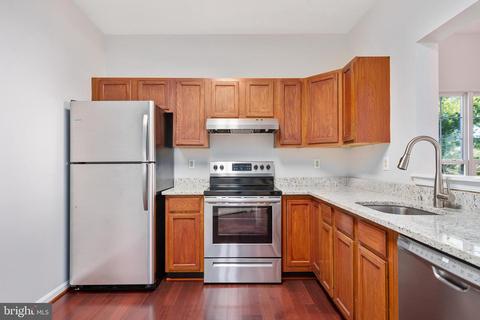
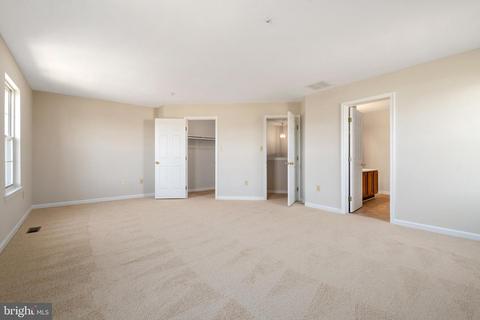
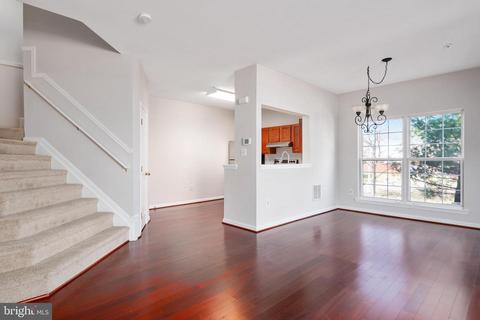
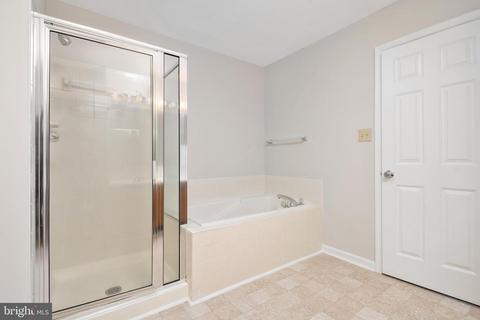
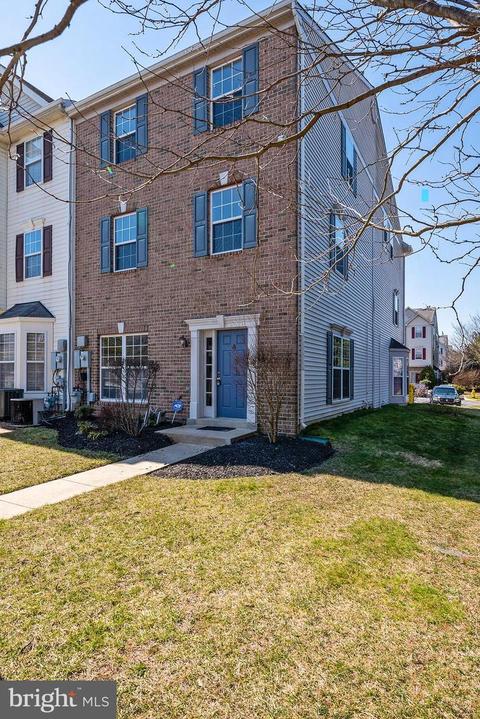
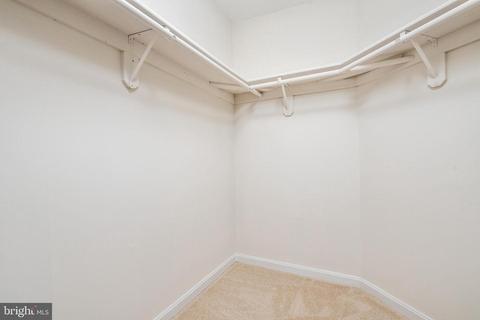
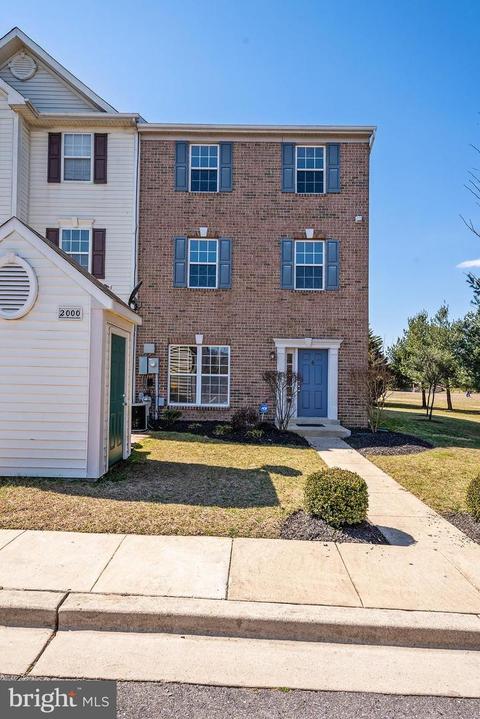
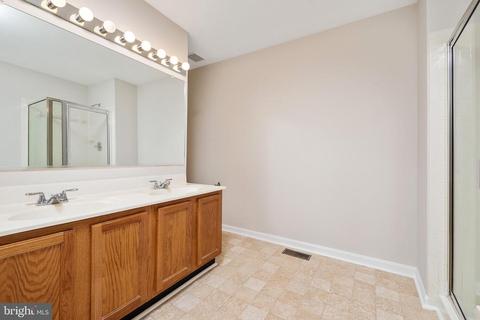
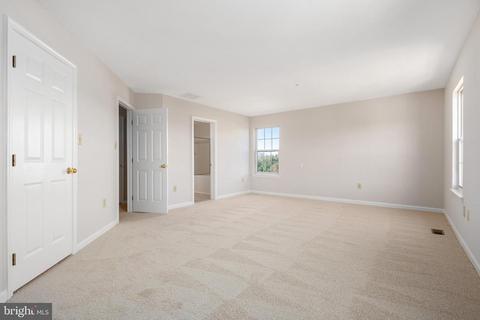
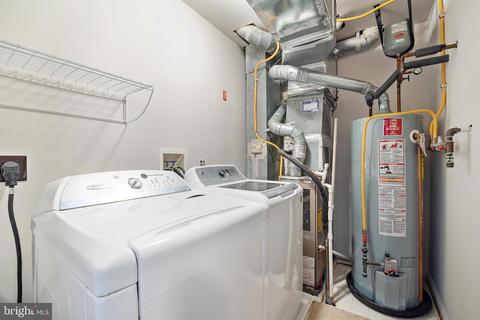
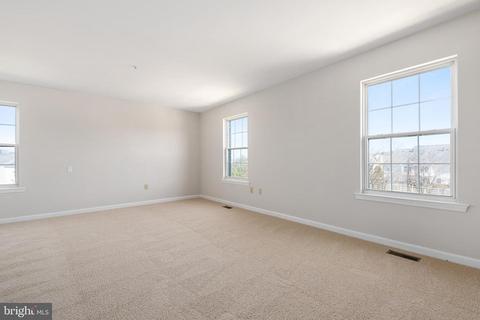
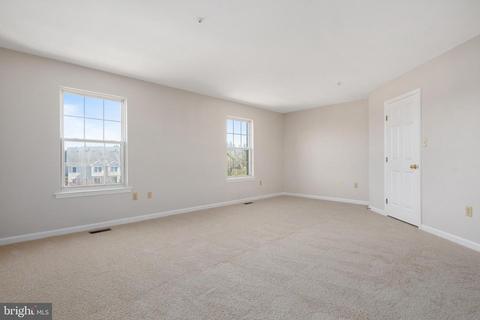
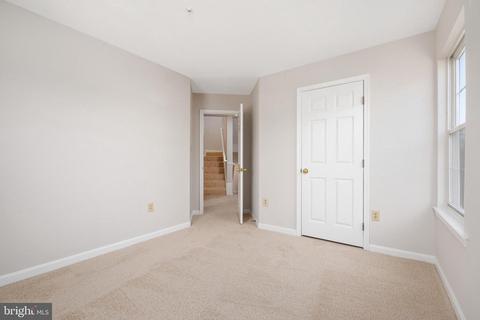
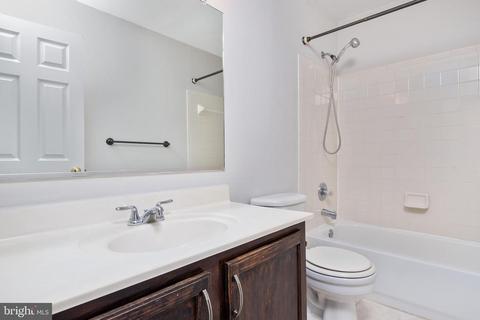
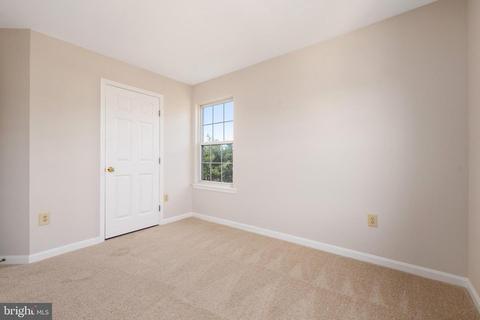
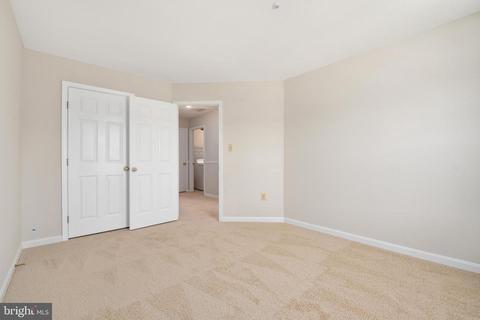
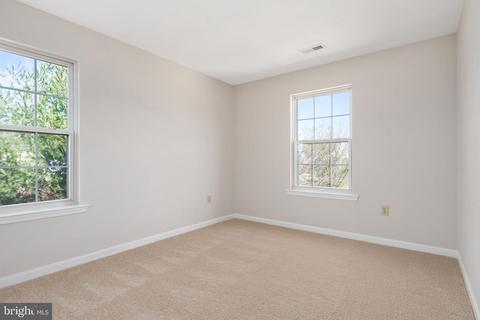
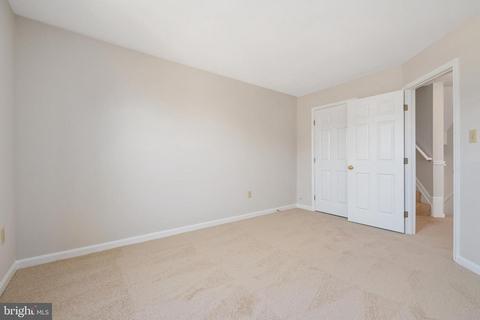
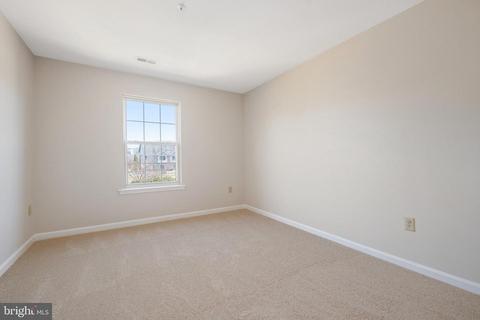
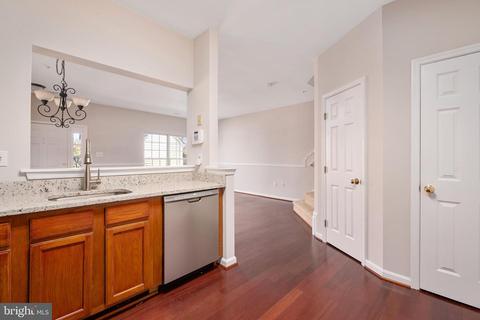
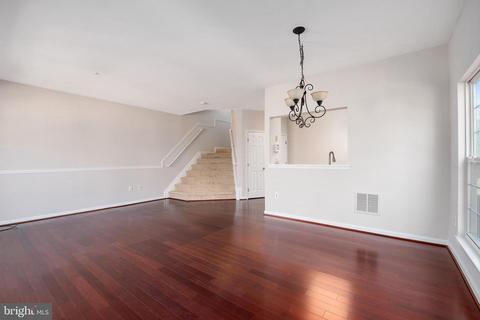
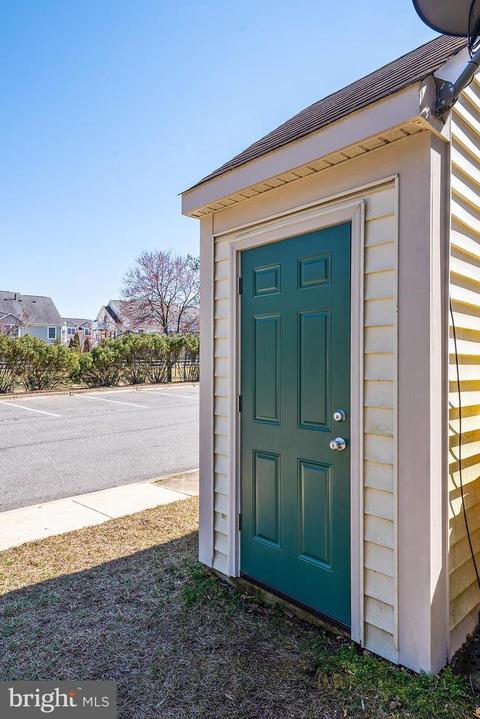
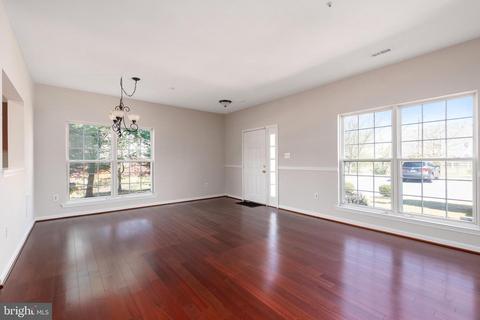
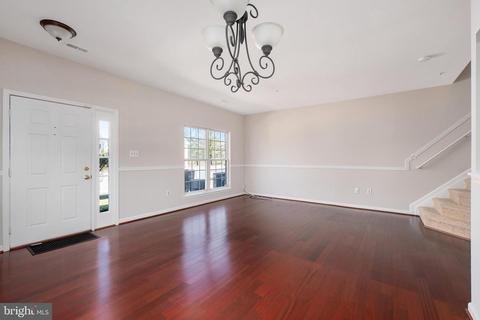
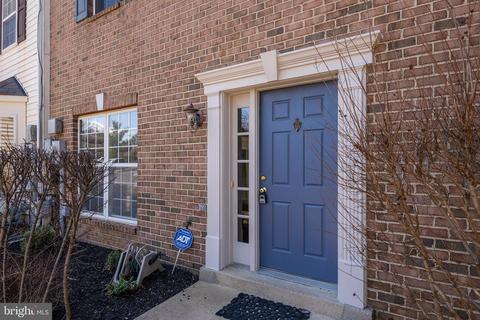
Last sold 04/18/2019 for $267K
bed
bath
Sqft ($156/Sqft)
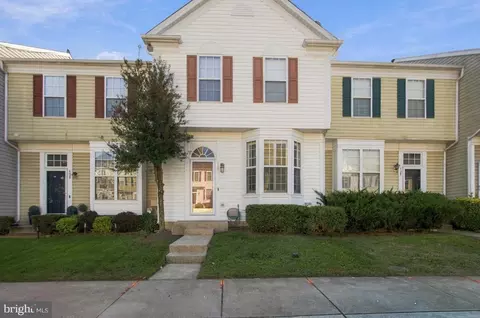
| Property type Townhouse | Neighborhood | Year built 1997 | HOA fee $70/month | Lot size 871 Sqft | Movoto estimate | Rental estimate |

| Overview | |
| Cooling/AC | Central A/C, Electric |
| Heating | Natural Gas |
| Levels/Style | Colonial |
| Type | Residential |
| Status | Closed |
| SqFt | 1716 |
| Lot Size (SqFt) | 836 |
| Lot Size (Acres) | 0.02 |
| County Tax | 2486, Annually |
| Tax: Assessed Value | 244000 |
| Annual Property Tax | 2784 |
| Year Built | 1997 |
| HOA Fee | 70, Monthly |
| New Construction (Y/N) | N |
| Foreclosure (Y/N) | N |
| Interior | |
| Total # of Bathrooms | 2 |
| # Full Baths | 2 |
| Total # of Bedrooms | 3 |
| Accessibility Features | None |
| Exterior | |
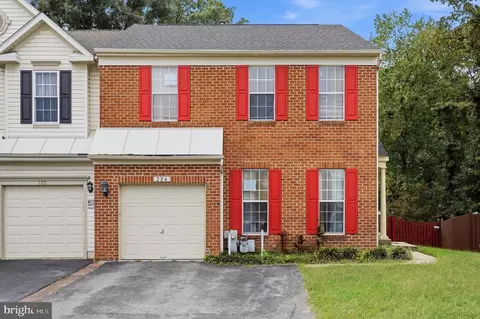
| Construction | Brick |
| Assigned Parking Spaces | 2 |
| Parking Desc | Assigned, Parking Lot |
| Existing Structures | Above Grade, Below Grade |
| Amenities / Utilities | |
| Sewer/ Septic | Public Sewer |
| Pool | Yes - Community |
| Location | |
| Subdivision | SEVEN OAKS |
| Water Source | Public |
| Senior Community (Y/N) | N |
| School District | ANNE ARUNDEL COUNTY PUBLIC SCHOOLS |
| Zoning | R15 |
MLS # MDAA378406
MLS # 1002272266| Est. value | Bed/bath | Sqft | mi | |
|---|---|---|---|---|
| 2002 Crosbyside Ct, Odenton, MD 21113 | $383,000 | 3/2 | 1,612 | 0.01 |
| 2004 Crosbyside Ct, Odenton, MD 21113 | $377,600 | —/2 | 1,600 | 0.01 |
| 2001 Tea Island Ct, Odenton, MD 21113 | $378,000 | 3/— | 1,768 | 0.01 |
| 2003 Tea Island Ct, Odenton, MD 21113 | $380,200 | 3/— | 1,560 | 0.01 |
| 2005 Tea Island Ct, Odenton, MD 21113 | $389,000 | 3/2 | 1,609 | 0.01 |
| 2006 Crosbyside Ct, Odenton, MD 21113 | $380,000 | —/2 | 1,572 | 0.01 |
| 2007 Tea Island Ct, Odenton, MD 21113 | $396,000 | 3/2 | 1,612 | 0.01 |
| 2008 Crosbyside Ct, Odenton, MD 21113 | $356,900 | —/2 | 1,609 | 0.02 |
Estimated values are based on public record data and automated valuation models. Values are not guaranteed and may not reflect current market conditions.


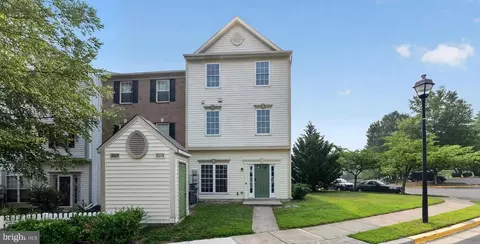
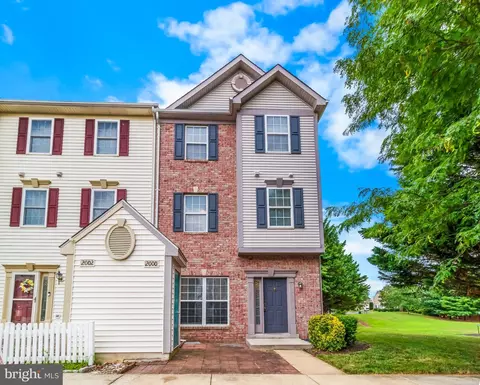

$479,900
$653,170
$214,450
$469,900
$380,000
$656,925
$514,000
$579,000
$599,900
$454,900
$469,990
$460,000
$300,000
$325,000
$450,000
$395,000
$557,494
$564,950
$587,500
$342,500
$2,000,000
$175,000
$509,950
$389,900
$1,349,200
$380,000
$812,500
$525,000
$949,900
$350,000