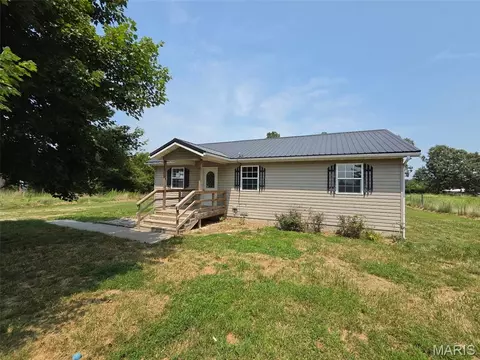
- $180,000
- 3Bd
- 2Ba
- 1,135 Sq Ft
Homes with Foreclosure For Sale in Niangua, MO
1 Homes
Don’t see what you’re looking for?
A local real estate agent is the best way to get access to exclusive and off-market properties so you can find home.
See More Homes
Adjust filters to expand your search.
1 - 1 of 1 Home for sale in Niangua, MO
Don’t see what you’re looking for?
A local real estate agent is the best way to get access to exclusive and off-market properties so you can find home.
Explore nearby locations
The prices shown are the median list prices.Springfield Homes for sale
$209,900
Marshfield Homes for sale
$220,000
Lebanon Homes for sale
$548,350
Ava Homes for sale
$164,900
Ozark Homes for sale
$840,000
Seymour Homes for sale
$210,000
Buffalo Homes for sale
$369,500
Strafford Homes for sale
$225,000
Fair Grove Homes for sale
$245,000
Conway Homes for sale
$45,000
Rogersville Homes for sale
$252,950
Willard Homes for sale
$284,995
Fordland Homes for sale
$294,250
Mansfield Homes for sale
$189,500
Elkland Homes for sale
$385,000
Sparta Homes for sale
$239,000
65706, MO Homes for sale
$265,000
65536, MO Homes for sale
$211,000
65746, MO Homes for sale
$225,000
65803, MO Homes for sale
$173,999
65802, MO Homes for sale
$224,975
65804, MO Homes for sale
$299,900
65622, MO Homes for sale
$179,000
65810, MO Homes for sale
$409,948
65742, MO Homes for sale
$252,950
65809, MO Homes for sale
$509,900
Cooper Estates Homes for sale
$654,900
Southern Hills Homes for sale
$329,900
Rountree Area Homes for sale
$219,000
Fox Grape Homes for sale
$389,450
University Heights Homes for sale
$375,000
Brentwood Homes for sale
$329,900
Tom Watkins Homes for sale
$119,900
Cinnamon Square Homes for sale
$275,000
Ravenwood South Homes for sale
$524,500
Walnut Street Homes for sale
$1,512,000
Webster County Homes for sale
$260,000
Laclede County Homes for sale
$211,000
Dallas County Homes for sale
$194,900
Greene County Homes for sale
$275,375
Wright County Homes for sale
$244,900
Narrow your search
Niangua, MO real estate market trends
Statistics as of November 2026
$766K
Avg. list price
$234/Sqft
Avg. price/sqft
18
Homes for sale
2,500 Sqft
Avg. home size
551 Days
Avg. days on market
Movoto makes it easy to track market trends in Niangua, MO. Whether you’re entering the market or planning your next move, understanding these key metrics can guide smart decisions. Looking for more detailed housing market stats in Niangua, MO?
Schools
Frequently Asked Questions about Niangua, MO
In November 2026 Niangua homes were listed to buy for a median price of $766K, The median value of a home listed to buy in Niangua in November 2026 was $234 per sqft,
It is expensive to live in Niangua. Buying a home in Niangua is 2% more expensive compared with the national average.
In November 2026, homes to buy in Niangua spent an median 510 days on the market, a same November 2025 last year.
The best and safest neighborhoods to live in Niangua in November 2026 are Walnut Street, Cooper Estates, Ravenwood South, Kingsbury Forest, Fox Grape, University Heights, Southern Hills, Brentwood, National Place, Cinnamon Square, Midtown, Downtown Springfield, Rountree Area, Grant Beach, Westside, Woodland, West Central, Fairfield Acres - Bissett, Tom Watkins
In November 2026, Niangua homes were listed to buy for a median price of $766K, with 25% down you would need $4.24K/month to cover expenses and assume that's 35% of your total monthly income, your total yearly income would need to be $145K.