

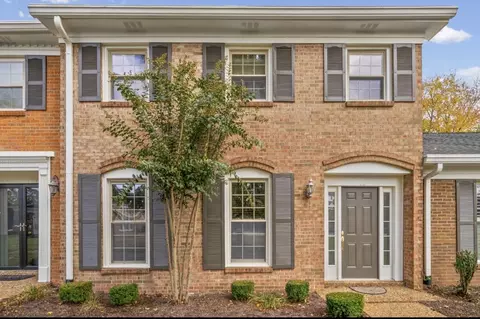
- $425,000
- 3Bd
- 2Ba
- 1,480 Sq Ft
SOLD


Last sold 07/22/2019 after 70 Days
bed
bath
Sqft ($187/Sqft)
| Property type House | Neighborhood | Year built 2019 | HOA fee $0/month | Lot size 4,356 Sqft | Rental estimate |

| Overview | |
| Cooling/AC | Central |
| Heating | Central |
| Levels/Style | Two, 2, Other |
| SubType | Single Family Residence |
| Type | Residential |
| MLS # | 2040344 |
| Living Area | 1950, Square Feet |
| Property Tax $ | 198 |
| Year Built | 2019, NEW |
| HOA Fee $ 2 | One Time |
| Interior | |
| Total # of Bathrooms | 3 |
| # of Full Baths | 2 |
| # of Half Baths | 1 |
| Total # of Bedrooms | 3 |
| Basement | Slab |
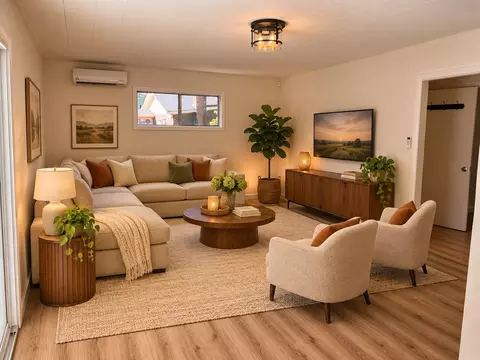
| Living Room | Fireplace |
| # Fireplaces | 1 |
| Exterior | |
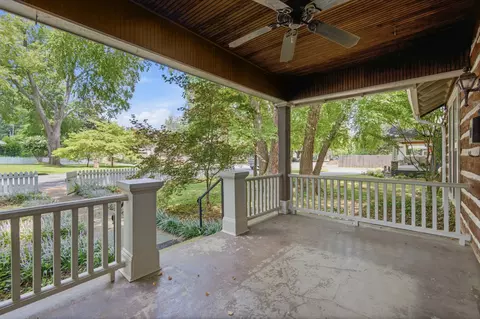
| Patio/ Deck | Covered Porch |
| Fencing | Partial |
| # Open Parking Spaces | 1 |
| # Covered Spaces | 2 |
| Parking Desc | Concrete |
| # Carport Spaces | 2 |
| # Parking Spaces | 3 |
| Exterior Features | Storage Building |
| Amenities / Utilities | |
| Water Source | Public |
| Sewer/ Septic | Public Sewer |
| Location | |
| County | Rutherford County |
| Subdivision | Downtown |
| Elementary School | Hobgood Elementary |
| High School | Siegel High School |
| Middle School | Whitworth-Buchanan Middle School |
| Directions | From S. Church St, Turn Right On Vine St, House On Right. |
| APN | 091M J 900 R0056258 |
MLS # 2040344| Est. value | Bed/bath | Sqft | mi | |
|---|---|---|---|---|
| 628 E Vine St, Murfreesboro, TN 37130 | $266,500 | —/1 | 1,088 | 0.01 |
| 702 E Vine St, Murfreesboro, TN 37130 | $289,600 | 2/2 | 1,282 | 0.01 |
| 624 E Vine St, Murfreesboro, TN 37130 | $280,600 | —/1 | 1,470 | 0.02 |
| 704 E Vine St, Murfreesboro, TN 37130 | $444,200 | 3/2 | 1,856 | 0.02 |
| 202 S Hancock St, Murfreesboro, TN 37130 | $474,000 | 2/1 | 1,824 | 0.02 |
| 203 S Hancock St, Murfreesboro, TN 37130 | $321,000 | —/— | 1,378 | 0.03 |
| 622 E Vine St, Murfreesboro, TN 37130 | $256,800 | —/1 | 930 | 0.03 |
| 204 S Hancock St, Murfreesboro, TN 37130 | $267,700 | —/1 | 984 | 0.03 |
Estimated values are based on public record data and automated valuation models. Values are not guaranteed and may not reflect current market conditions.





$429,990
$447,900
$614,950
$401,225
$889,900
$379,950
$425,000
$1,989,900
$320,990
$599,900
$399,900
$524,343
$500,000
$1,742,500
$1,749,900
$439,900
$504,020
$343,400
$1,255,000
$420,000
$2,995,000
$1,354,900
$2,962,500
$3,322,500
$3,675,000
$1,500,000
$1,099,000
$3,599,900
$521,900
$4,044,996