
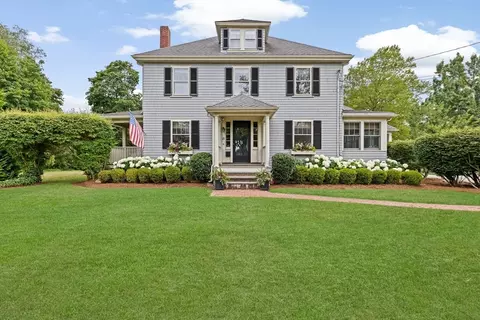
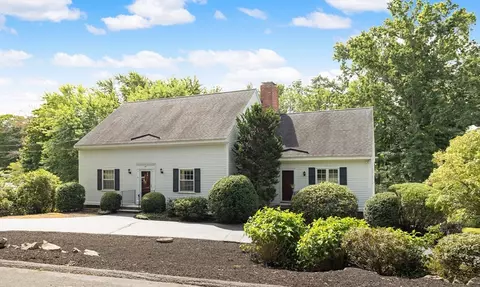
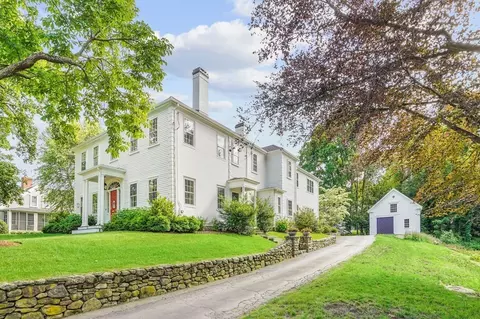
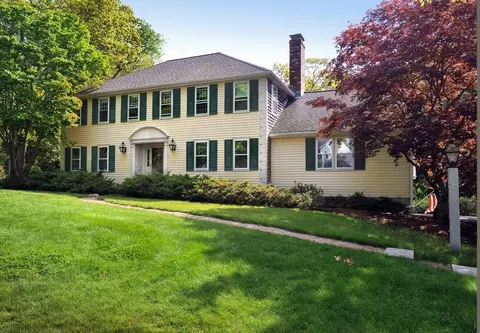
- $3,000,000
- 4Bd
- 5Ba
- 4,868 Sq Ft
SOLD 05/29/26


Last sold date unavailable
bed
bath
Sqft ($668/Sqft)
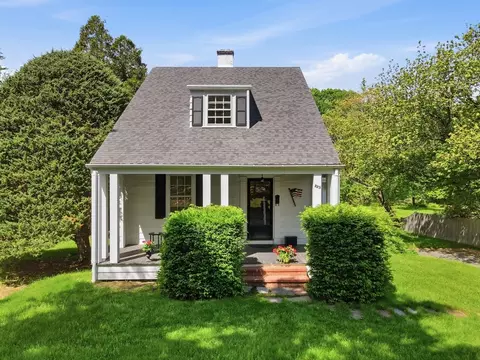
| Property type House | Year built 1930 | HOA fee $0/month | Lot size 8,542 Sqft | Movoto estimate | Rental estimate |
| Est. value | Bed/bath | Sqft | mi | |
|---|---|---|---|---|
| 3 Playground Rd, Hingham, MA 02043 | $1,475,000 | 4/2 | 2,286 | 0.02 |
| 8 Playground Rd, Hingham, MA 02043 | $1,817,000 | 3/2 | 2,728 | 0.03 |
| 317 Main St, Hingham, MA 02043 | $1,853,000 | 3/4 | 1,890 | 0.03 |
| 2 Playground Rd, Hingham, MA 02043 | $1,022,000 | 4/1 | 1,449 | 0.04 |
| 331 Main St, Hingham, MA 02043 | $1,805,000 | 4/2 | 2,542 | 0.06 |
| 297 Main St, Hingham, MA 02043 | $2,119,000 | 4/2 | 3,540 | 0.06 |
| 58 Burr Rd, Hingham, MA 02043 | $1,792,000 | 5/4 | 3,593 | 0.08 |
| 289 Main St, Hingham, MA 02043 | $1,913,000 | 4/2 | 3,672 | 0.08 |
Estimated values are based on public record data and automated valuation models. Values are not guaranteed and may not reflect current market conditions.
$594,000
$1,395,000
$490,000
$738,500
$499,000
$789,000
$549,990
$999,999
$739,000
$595,000
$774,900
$575,000
$2,395,000
$749,900
$599,900
$549,900
$1,137,500
$739,000
$729,000
$789,000
$879,000
$597,000
$2,787,000
$739,900
$1,199,998
$679,900
$1,995,000
$2,125,000
$1,550,000
$826,350