
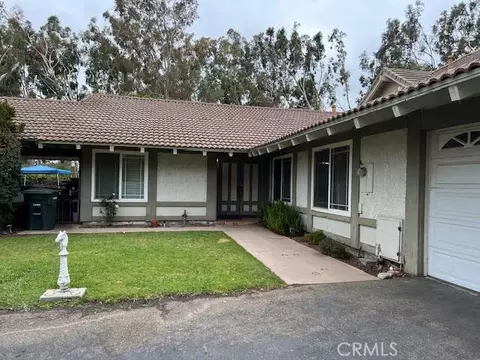
- $960,000
- 3Bd
- 2Ba
- 1,765 Sq Ft
SOLD


Last sold 09/27/2013 for $867K
bed
bath
Sqft ($314/Sqft)
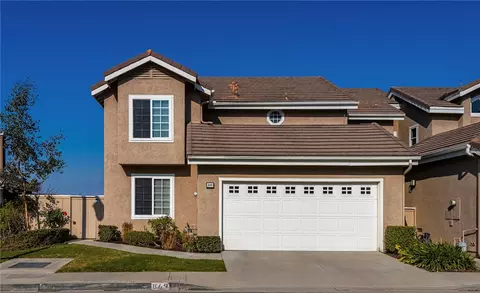
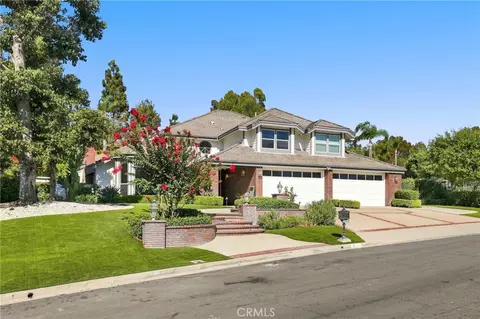
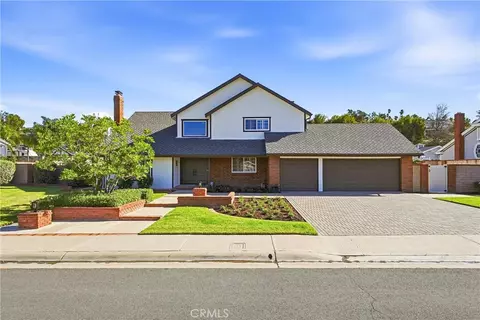
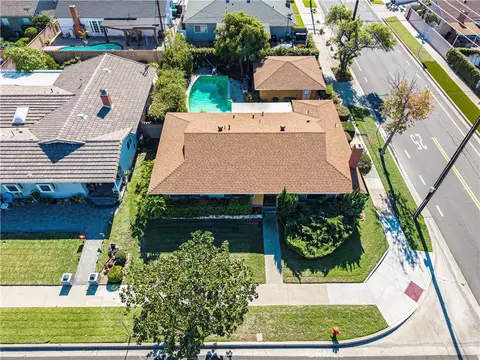
| Property type House | Neighborhood | Year built 1978 | HOA fee $52/month | Lot size 9,583 Sqft | Movoto estimate | Parking 3 garage spaces | Rental estimate |

| Overview | |
| Price / SqFt | 313.79 |
| SubType | Single Family Residence |
| Year Built | 1978 |
| Interior | |
| Total # of Bathrooms | 3 |
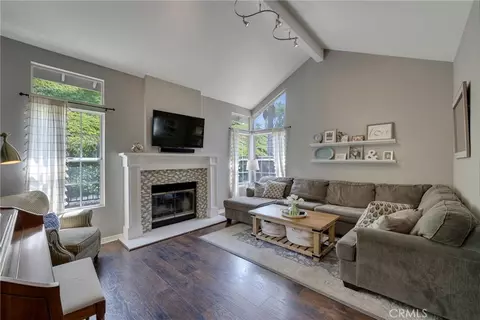
| Other Room(s) | All Bedrooms Down |
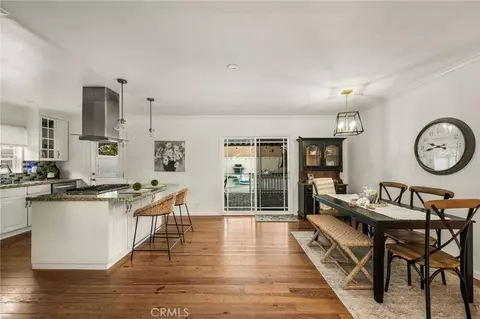
| Eating Area | Breakfast Nook, Formal Dining Room |
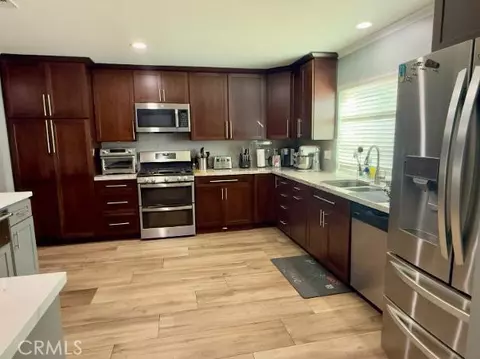
| Appliances | Dishwasher, Double Oven, Garbage Disposal, Gas Range, Microwave |
| Interior Features | Beamed Ceilings, Ceiling Fan, Granite Counters, Kitchen Open To Family Room, Open Floor Plan, Recessed Lighting, Remodeled Kitchen |
| Window Features | Double Pane Windows |
| Exterior | |
| Roofing | Concrete |
| Construction | Stucco, Wood |
| Lot Description | Access Via City Streets |
| Amenities / Utilities | |
| Sewer/ Septic | Sewer Connected |
| Water Source | District/Public |
| Location | |
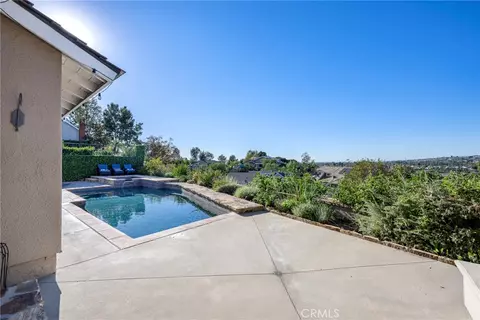
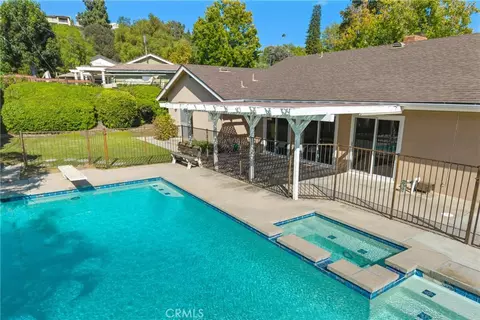
| View | Hills, Neighborhood, Pool |
| County | Orange |
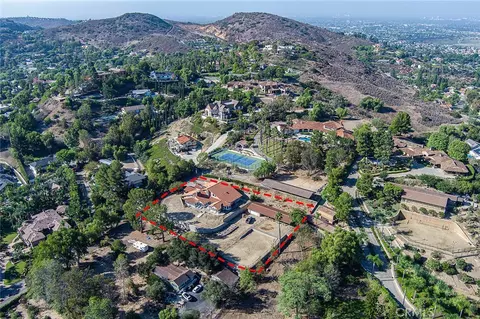
| Community Features | Horse Trails, Sidewalks, Suburban |
| Area | 75 - Orange, Orange Park Acres E Of 55 |
| School District | Orange Unified |
| Directions | From Cannon Head East On Serrano. Turn Right At The First Light Onto Mount McKinley. Mount McKinley Becomes Mabury. House Will Be On Your Left. |
MLS # PW13154995| Est. value | Bed/bath | Sqft | mi | |
|---|---|---|---|---|
| 6121 E Mabury Ave, Orange, CA 92867 | $1,411,800 | 3/2 | 1,940 | 0.02 |
| 6049 E Mabury Ave, Orange, CA 92867 | $1,606,000 | 4/2 | 2,331 | 0.02 |
| 6133 E Mabury Ave, Orange, CA 92867 | $1,645,700 | 4/3 | 2,653 | 0.03 |
| 6037 E Mabury Ave, Orange, CA 92867 | $1,519,900 | 4/3 | 2,136 | 0.04 |
| 6122 E Bryce Ave, Orange, CA 92867 | $1,199,400 | 2/2 | 1,724 | 0.04 |
| 6048 E Bryce Ave, Orange, CA 92867 | $1,429,000 | 4/2 | 2,331 | 0.04 |
| 6145 E Mabury Ave, Orange, CA 92867 | $1,398,300 | 2/2 | 1,724 | 0.05 |
| 6132 E Bryce Ave, Orange, CA 92867 | $1,624,800 | 4/3 | 2,653 | 0.05 |
Estimated values are based on public record data and automated valuation models. Values are not guaranteed and may not reflect current market conditions.
$897,986
$769,000
$1,100,000
$975,000
$1,245,000
$754,990
$650,000
$1,095,000
$1,124,500
$2,600,000
$1,122,500
$550,000
$1,550,000
$724,950
$3,595,000
$898,000
$1,275,000
$950,000
$1,388,000
$699,000
$368,000
$1,800,000
$1,338,000
$3,575,000
$308,450
$1,024,450
$499,000
$1,288,888