

- $106,500
- 2Bd
- 1.5Ba
- 1,403 Sq Ft
SOLD

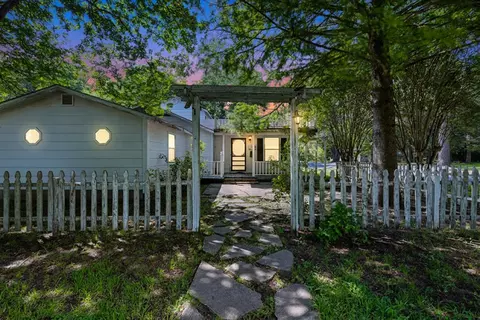


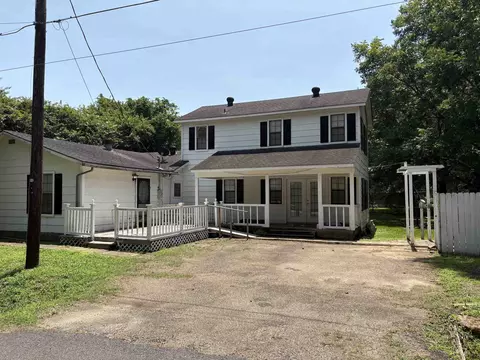
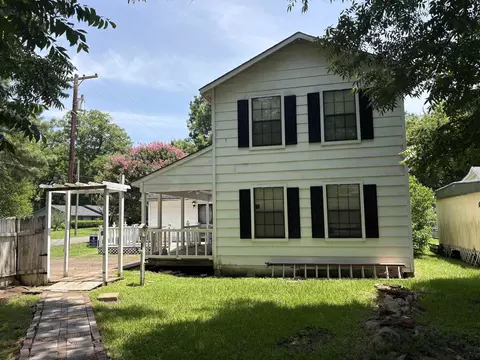
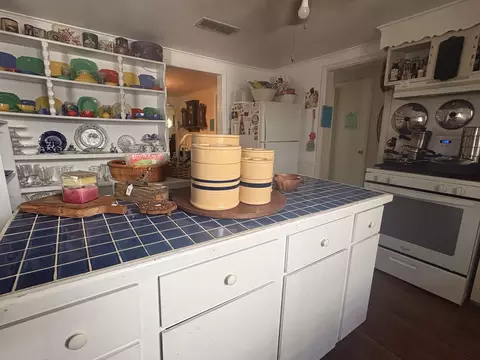
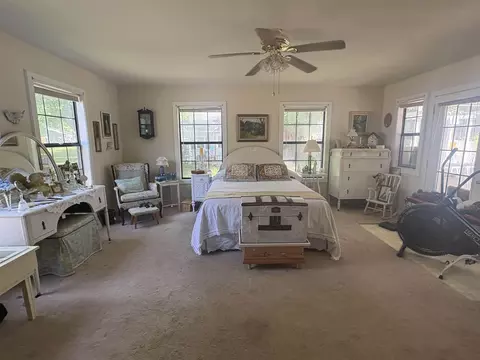
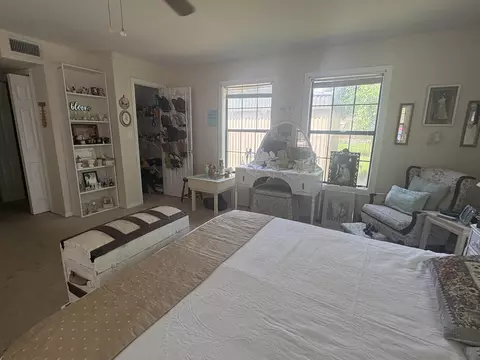
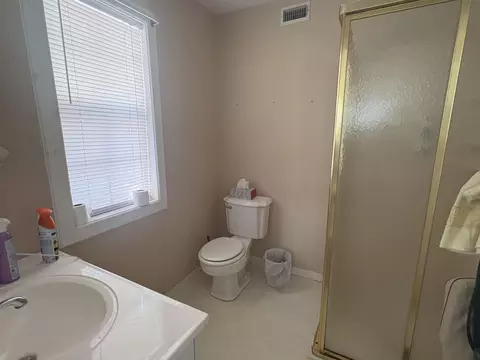
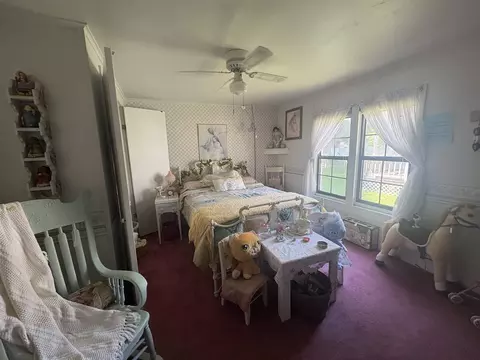
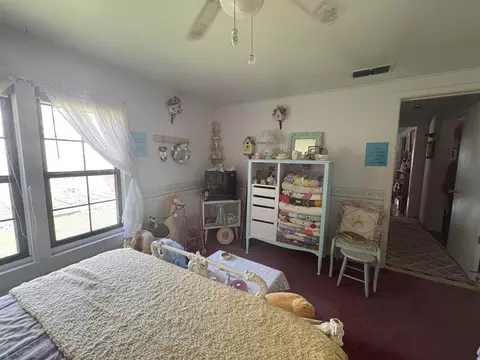
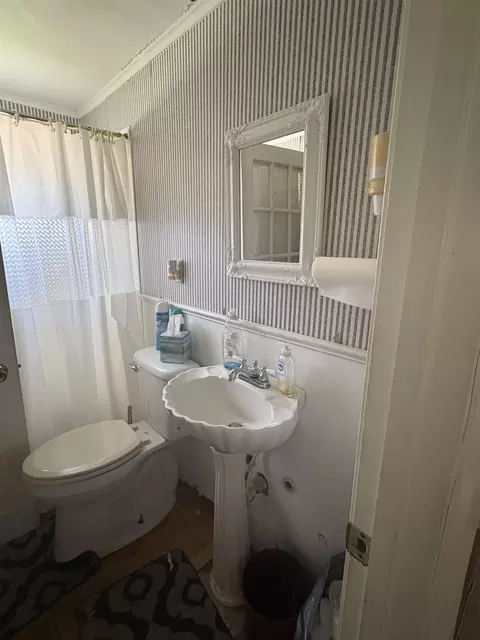
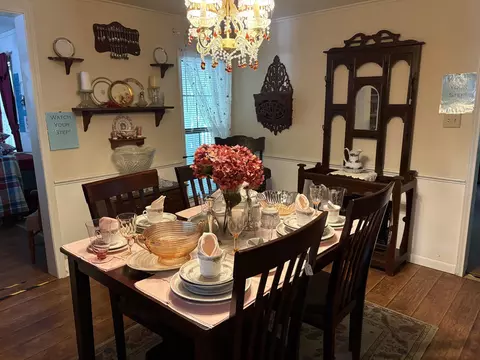
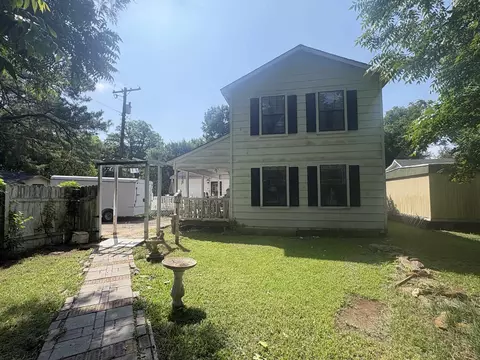
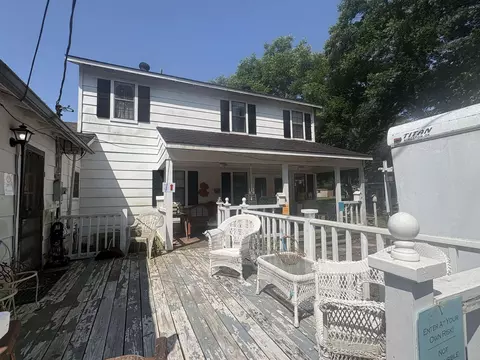
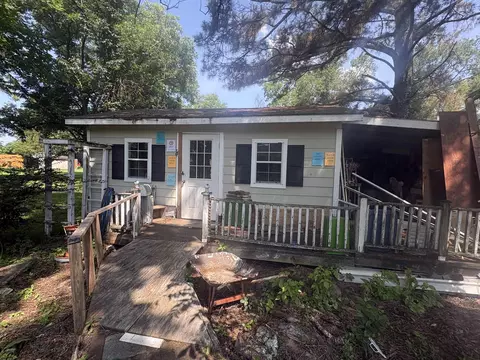
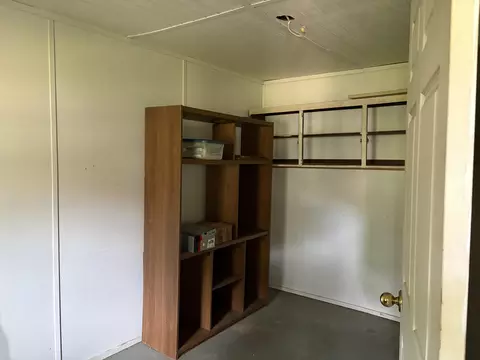
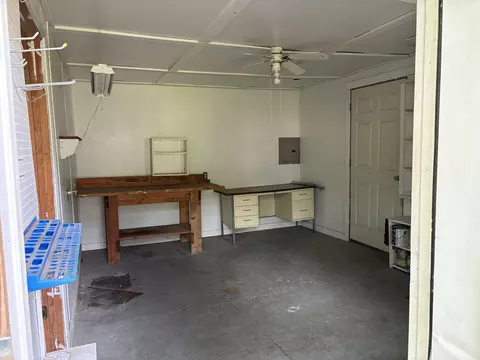
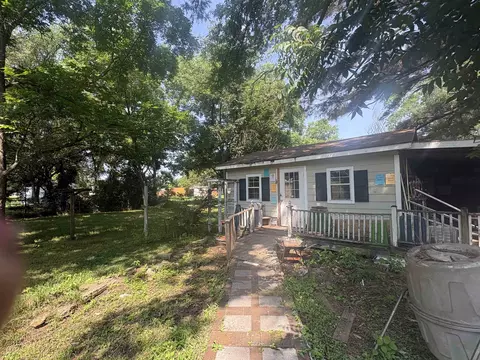
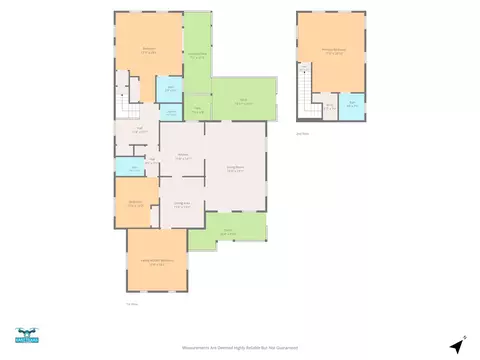
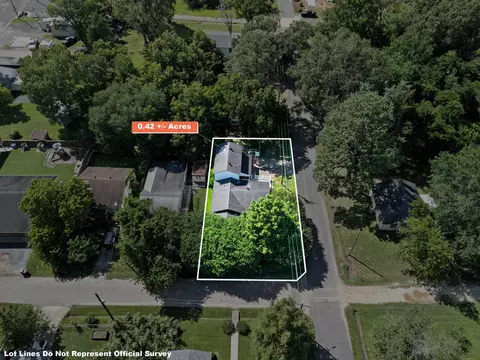
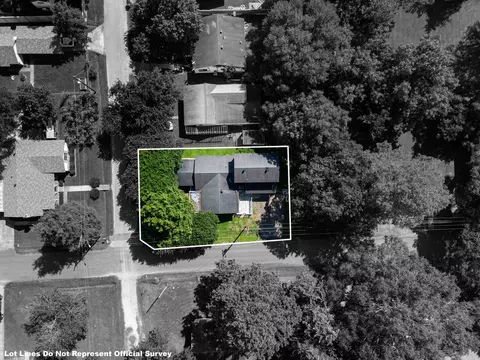
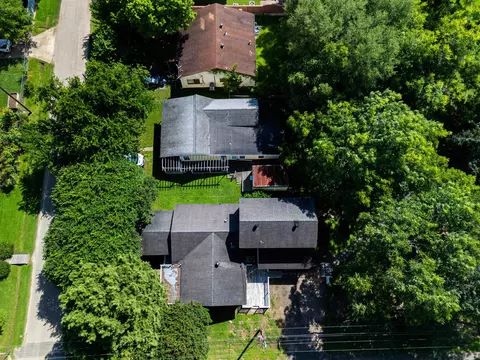
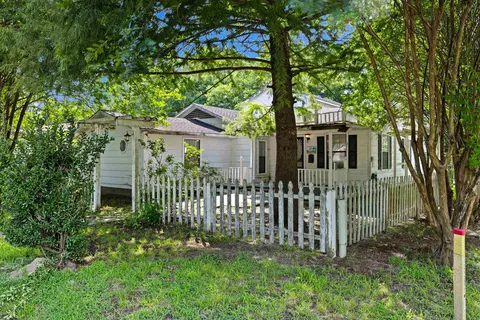
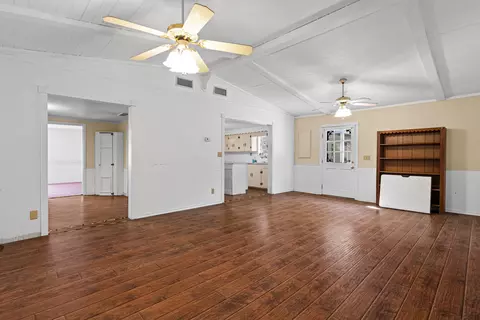
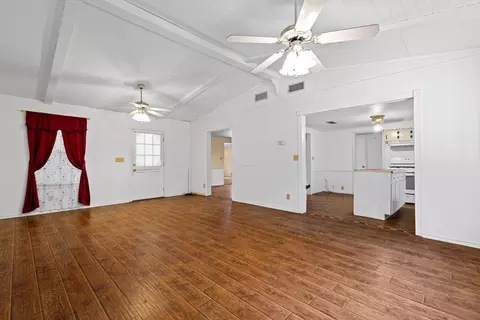
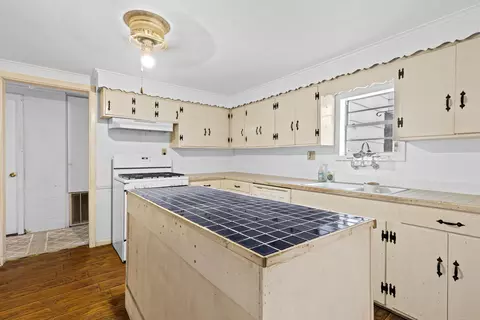
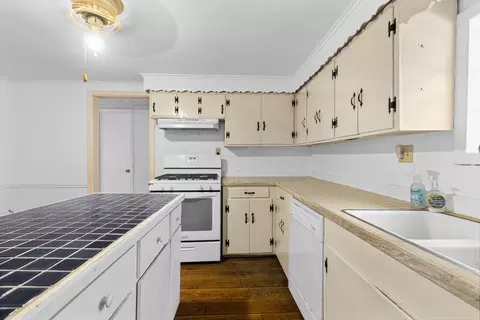
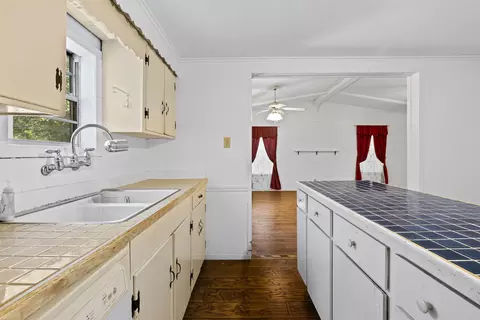
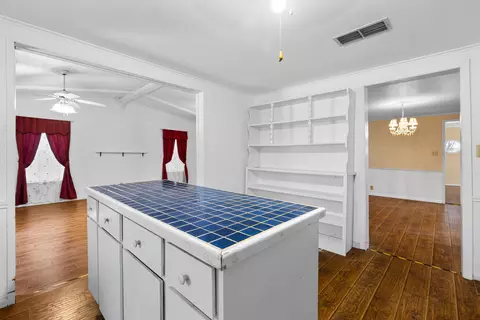
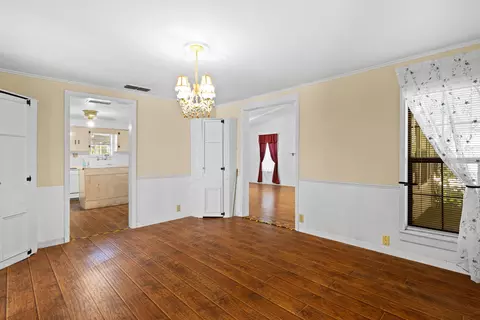
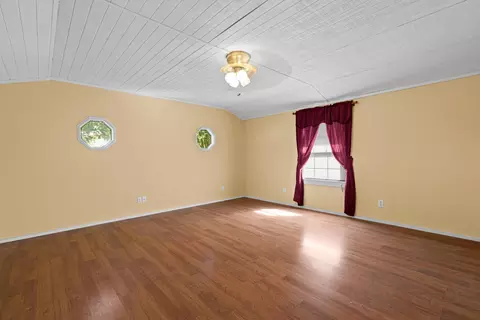
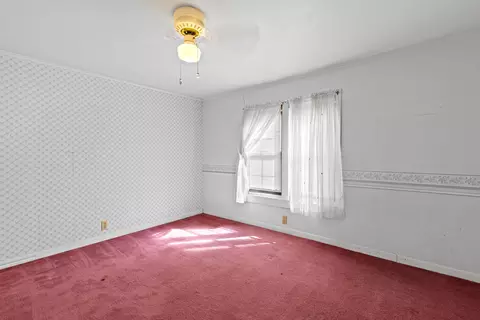
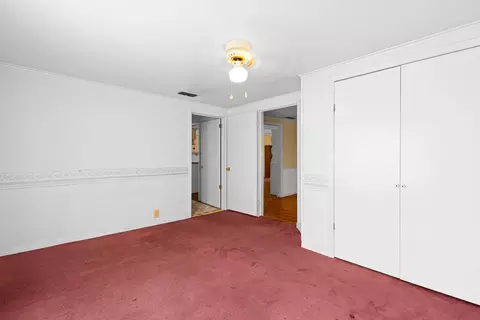
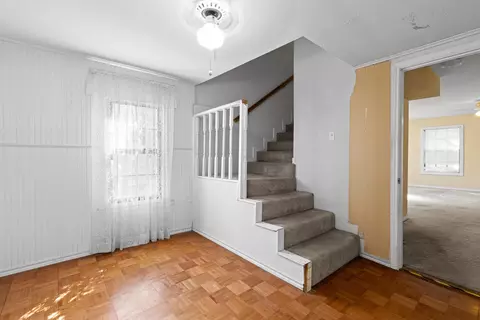
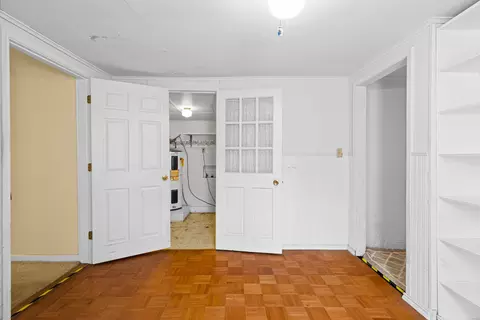
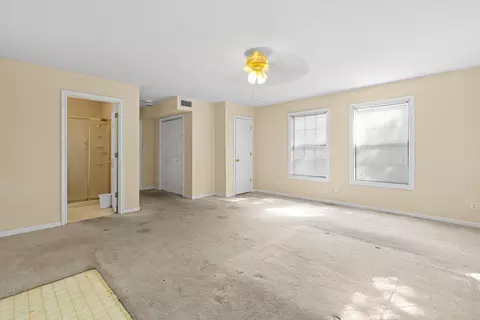
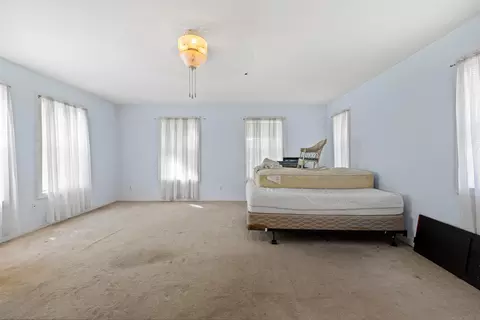
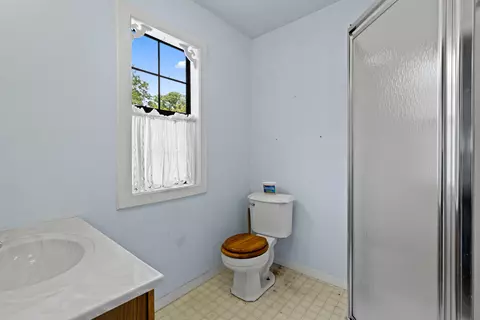
Last sold 07/24/2026
bed
bath
Sqft ($55/Sqft)
| Property type House | Neighborhood | Year built 1940 | HOA fee $0/month |

| Overview | |
| Cooling/AC | Central Electric |
| Heating | Central Gas |
| Levels/Style | 1.5 Stories |
| Status | SOLD |
| MLS # | 20264034 |
| SqFt | 2200, 2200 |
| Type | RESIDENTIAL |
| SubType | Single Family |
| Lot Size (acres) | 0.5-1 |
| Prop Tax | 2402.07 |
| Foreclosure Y/N | No |
| Year Built | 1940 |
| Interior | |
| Full Bath | 3 |
| Room Desc | 2 Living Areas |
| Total # of Rooms | 6 |
| Interior Features | Smoke Detectors |
| Appliances | Gas Range/Oven |
| Fireplace | None |
| Exterior | |
| Exterior Features | Deck Open |
| Fencing | Wood Fence |
| Construction | Wood/Frame |
| Foundation | Pier And Beam |
| Roof | Composition |
| Garage Desc | None |
| Parking Desc | None |
| Amenities / Utilities | |
| Water Heater | Gas |
| Sewer/ Septic | Public Sewer |
| Water Source | City |
| Pool/ Spa Desc | None |
| Location | |
| Waterfront | No |
| County | Marion |
| School District | Jefferson |
| APN | 19365 |
| Directions | At Corner Of Hwy 59 And 49 Go East On 49 (Broadway) To Walnut Then East To Bonham. Corner Of Bonham And N Soda St |
| Lot/ Land Details | |
| Number of Acres | Less Than 0.5 Ac |
| Road Frontage | City/Town Road, Asphalt |
MLS # 20264034| Est. value | Bed/bath | Sqft | mi | |
|---|---|---|---|---|
| 209 E Bonham St, Jefferson, TX 75657 | $175,000 | —/— | 1,856 | 0.01 |
| 602 N Soda St, Jefferson, TX 75657 | $171,000 | 2/1 | 1,080 | 0.02 |
| 606 N Soda St, Jefferson, TX 75657 | $112,000 | —/— | 2,130 | 0.02 |
| 212 E Bonham St, Jefferson, TX 75657 | $236,000 | —/— | 4,027 | 0.03 |
| 510 N Soda St, Jefferson, TX 75657 | $207,000 | —/— | 1,710 | 0.04 |
| 507 N Soda St, Jefferson, TX 75657 | $266,000 | —/— | 2,012 | 0.04 |
| 508 N Soda St, Jefferson, TX 75657 | $221,000 | 3/3 | 2,647 | 0.05 |
| 520 N Walnut St, Jefferson, TX 75657 | $295,000 | 2/1 | 2,071 | 0.05 |
Estimated values are based on public record data and automated valuation models. Values are not guaranteed and may not reflect current market conditions.






$329,000
$272,500
$194,900
$295,750
$249,200
$87,500
$140,000
$117,400
$260,000
$30,000
$139,000
$226,875
$278,200
$360,000
$199,000
$437,450
$289,999
$199,450
$231,100
$324,450
