New to the DC Metropolitan area and need help deciding which suburb is right for you? Then check out this helpful guide!
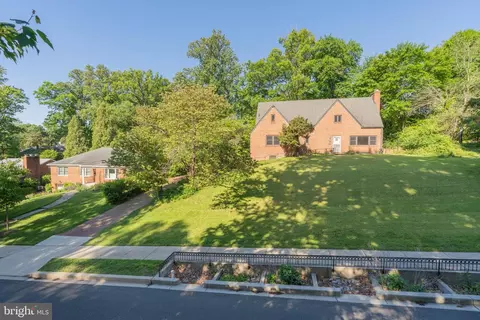
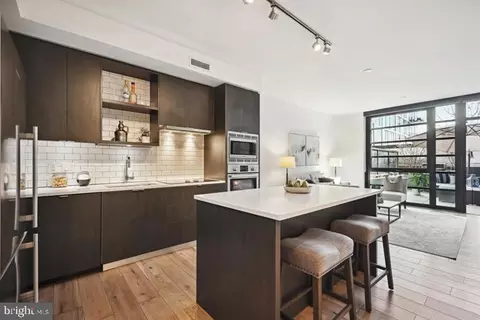
- $1,800,000
- 5Bd
- 2Ba
- 3,115 Sq Ft
New 19 Min


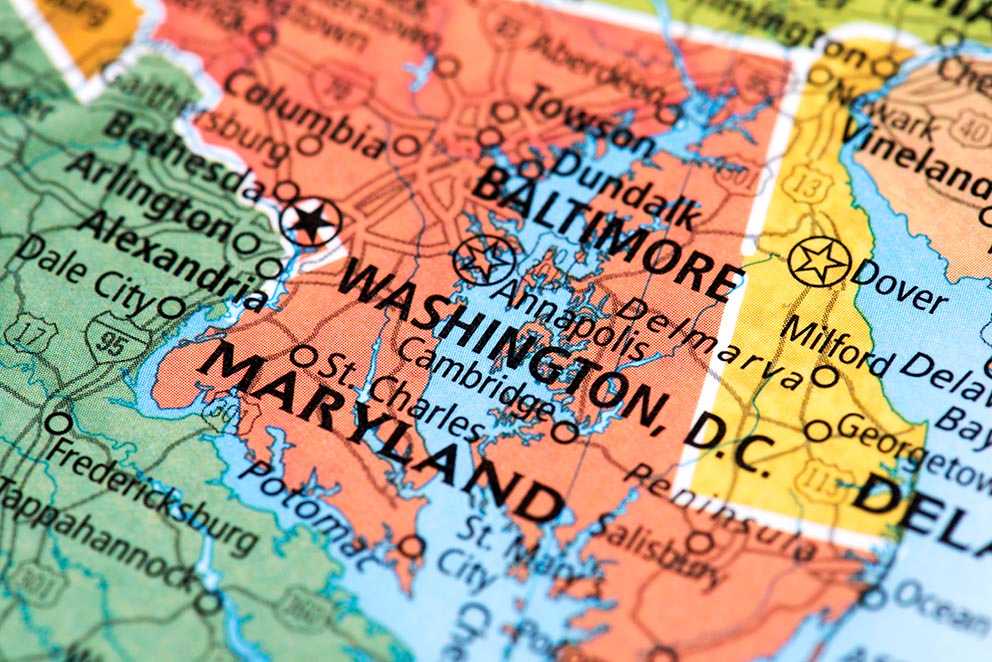
Moving to the Washington, DC area? Movoto is your trusted resource for all things real estate in the Washington, DC suburbs. Start your search with Kensington, MD real estate, using our neighborhood information below.
Kensington is a town in Montgomery County, Maryland. Primarily farm land until the 1870's, Kensington grew from a crossroads of the B&O Railroad and Old Bladensburg to Rockville Road. By the 1890's, developers planned a community that became incorporated as Kensington in 1894.
Significant roadways include Route 185, Connecticut Avenue, which leads to Washington, DC; Route 193 (University Boulevard) which connects Kensington to Silver Spring and College Park (home of the University of Maryland); and Route 547, which connects Kensington to Bethesda and Garrett Park.
Kensington is 10.6 miles (30 minutes) from Washington, DC via 16th Street, N.W. The town is 36.5 miles (40 minutes) from Baltimore, Maryland via I-95 South.
Currently, 45 homes are available with a median list price of $649,000 and a median size of 2,800 square feet. The median price per square foot is $254. Most recently, owners sold 225 homes. Area homes are 80% owner-occupied.
If you have children, note that 4,815 (26%) of the area residents are under the age of 18. Another 3,940 residents (25%) are 18-39 years old. Residents age 40-64 years old are the largest group with 7,099 residents (38%). If you have retirees in your household, they will have company because 3,033 residents, or 16%, comprise that age group.
With respect to employment, 63% of residents are employed while a full 32% are not in the labor force at all. Kensington's unemployment rate mirrors the national average at five percent. Your neighbors are highly educated with 45% having earned bachelors' degrees and another 37% holding post-graduate degrees. Only 18% hold a high school diploma or less. With such a highly educated group, it is no surprise that residents work primarily in the education/health sector (24%) and at professional levels (22%). The third highest segment are residents who work in public administration (15%).
Your neighbors are financially secure with household income of $150,000 or more for 36% of residents. Another 30% of residents have household income between $75,000 to $149,999. The third largest group, 22%, has household income between $30,000 and $74,999. Only 11% of residents have household income less than $30,000.
More than half of households (3,559, or 51%) consist of 2-3 persons. One-person households and 4-5 person households each make up 23% of homes (for a combined total of 3,263). A mere 3% of homes has a 6 or more person household.
If your search entails larger homes, Kensington will please you. Homes with 7-8 rooms comprise 37% of the homes while another 30% have 9 or more rooms and 31% have 4-6 rooms. If you need four bedrooms, you should succeed because 32% of the homes have four bedrooms. Three bedroom units make up 37% of households while homes with five or more bedrooms make up 11% of units.
If you want a home with history, Kensington has 1,546 (or 21%) of homes with construction dates before 1950. A majority of homes (5,319, or 74%) have construction dates between 1950 and 1989. Only 3% of homes (or 350) have construction dates after 1990.
If you seek income-producing property, know that 67% of the renter-occupied units charge $1,000 or more. The largest number of renters (30%) pay between $1,500 and $1,999. On the other hand, 33% of the units charge rents under $1,000.
Our market snapshot shows inventory today of 53 homes which is a 7% decrease over inventory one year ago. The median list price today is $594,000 which is an 8% decrease over prices one month ago but a 14% increase over prices from one year ago. In the last month, the number of days on Movoto's listings increased 11% to 70 days.
In the six-month period from July through December 2015, there were no listing price increases and there were 37 price reductions, all but six of them in the single family home sector. During the same period, there were 102 new listings, all but 17 of which were single family homes. In the same period, there were 482 homes sold/closed, of which only 57 were condo/townhouses.
Median list prices over the last five years hovered near $500,000 with recurring peaks and valleys. Notable dips occurred in 2012 and 2014 when list prices dipped into the low $400,000's. Since the low of $514,900 in December 2015, the median list price rebounded in February 2016 to its current high of $699,000.
The market in single family homes is brisk. Prices have been relatively stable within a small band of peaks and valleys since they started rising in August 2014. At this point in time, prices appear stable going forward with minor corrections every so often.
Condos/townhouses show buyers have room to negotiate a good price. Inventories are at the lowest they've been in two years while the prices appear relatively stable at $245,000. As inventories decrease further, prices will start to rise. Strike now before it becomes a seller's market.